Bug #4487
closedrevisit fn-advance / rts-advance default settings
100%
Description
We currently use a fn-advance default of of 20 frames, and a rts-advance of 5, resulting in a total of 25 frames (equalling 115ms) of downlink frame nubmer advance.
This will cause- significantly increased RTT for GPRS user plane data
- increase latency of RLC/MAC signaling, specifically
- tbf establishment
- potentially cause window stalls if we don't poll for ACK/NACK a lot sooner than our window filling up.
- probably mess with LAPDm timing
I would guess that on modern hardware, particularly with SCHED_RR on TRX + BTS, we can reduce the fn_advance drastically. The rts_advance likely needs to remain in place without too many changes, as this is the amount of time the PCU has to prepare downlink data (i.e. schedule DL).
As a second step, we could possibly even think of something like a dynamically sized fn-advance, similar to dynamic jitter buffers work in RTP.
Files
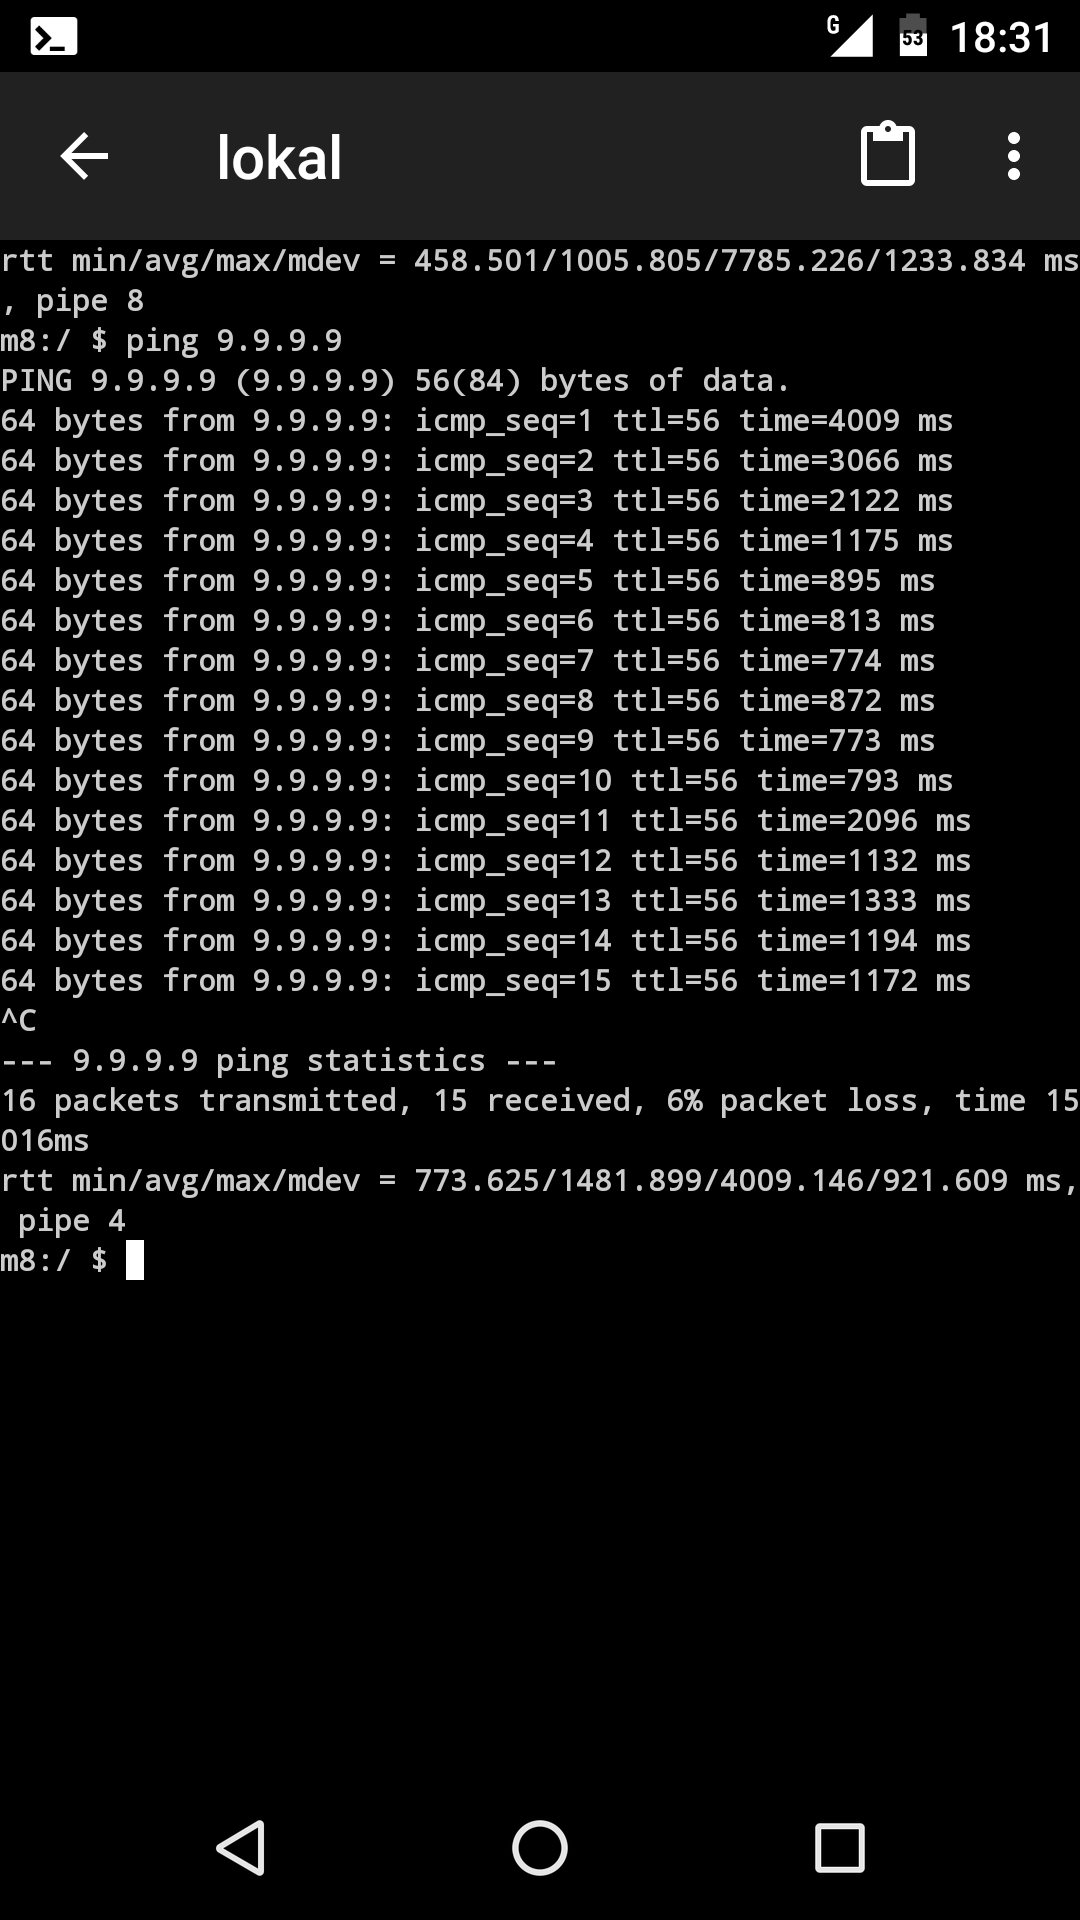
| Screenshot_20200408-183109.png | View Screenshot_20200408-183109.png | 196 KB | osmo-bts-trx ping with fn-advance 20 | ||
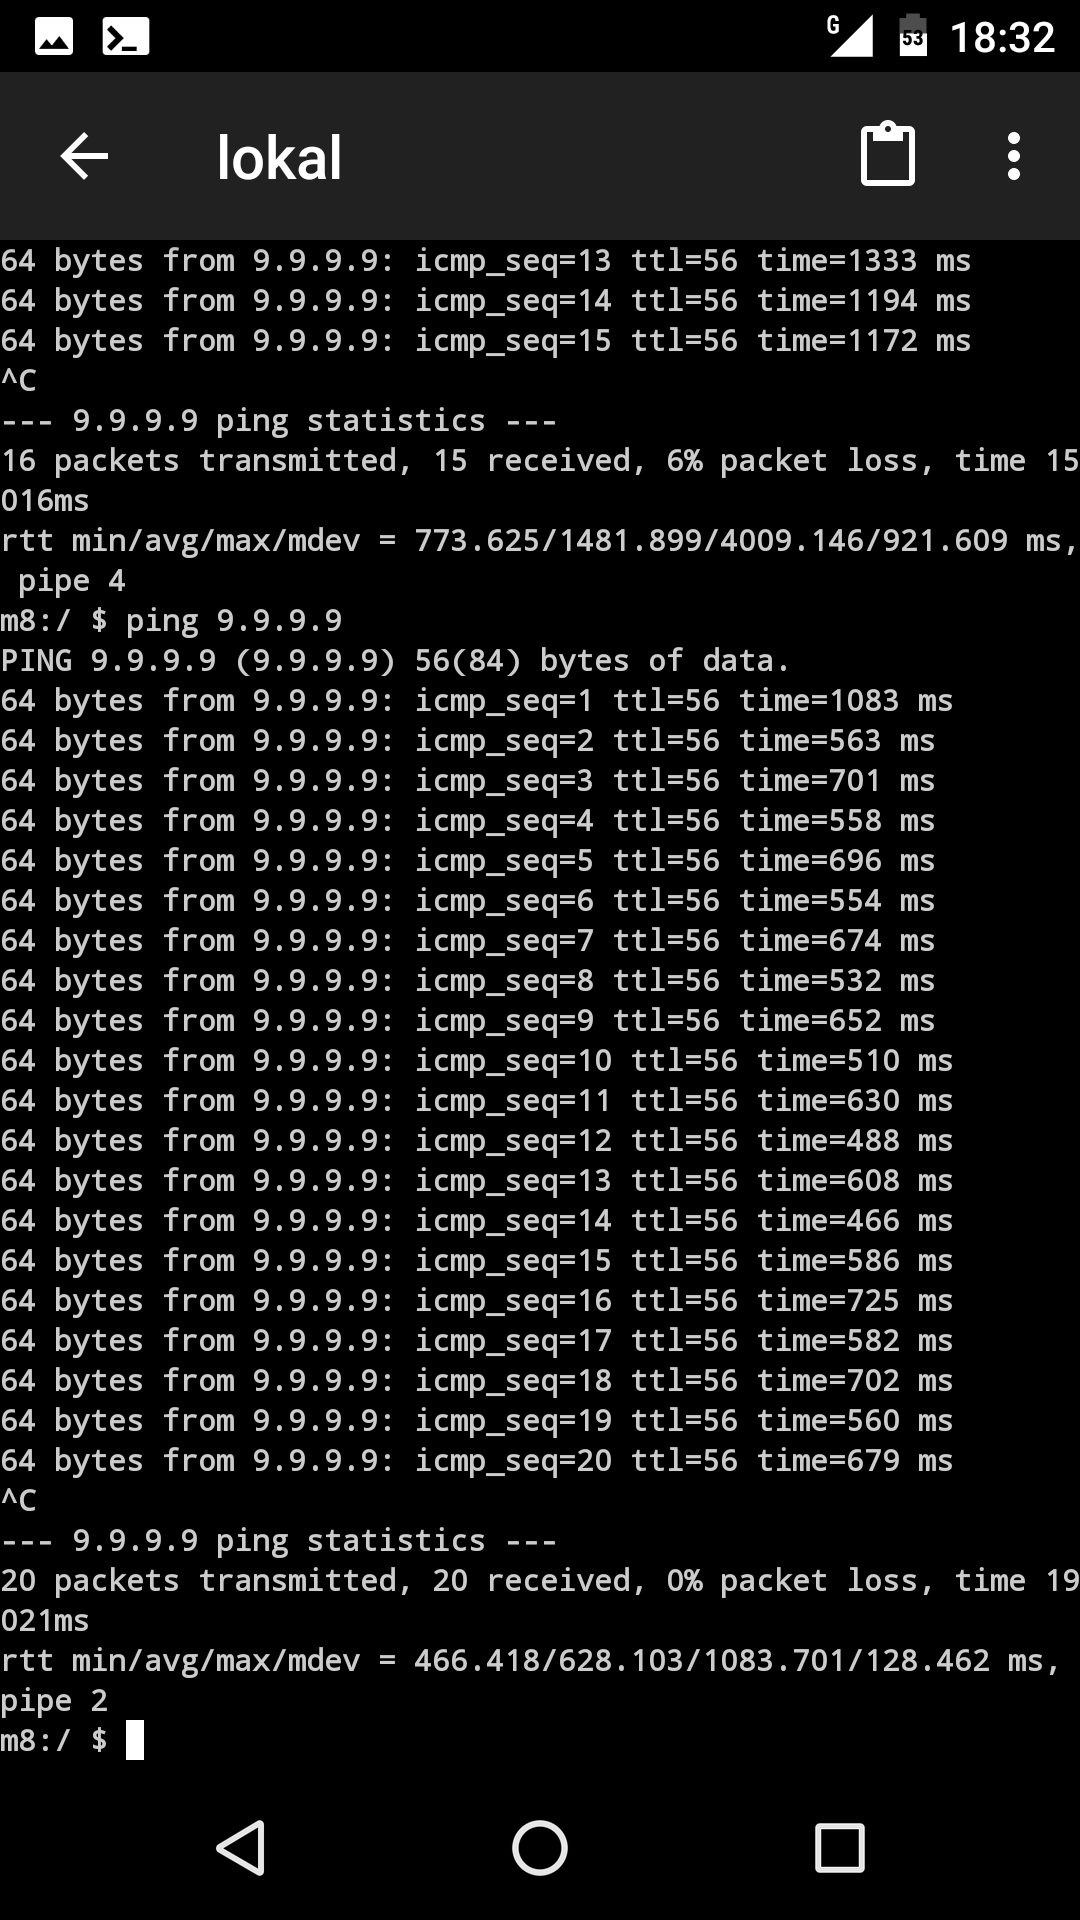
| Screenshot_20200408-183218.png | View Screenshot_20200408-183218.png | 276 KB | osmo-bts-trx ping with fn-advance 3 |
Related issues
Updated by daniel about 4 years ago
- File Screenshot_20200408-183109.png Screenshot_20200408-183109.png added
- File Screenshot_20200408-183218.png Screenshot_20200408-183218.png added
- Status changed from New to In Progress
So far on my laptop I reduced fn-advance to 3 and pings look a lot better.
Updated by daniel about 4 years ago
https://gerrit.osmocom.org/c/osmo-bts/+/17766
Please test with those or even lower values and report back what still works.
Updated by laforge about 4 years ago
- Assignee changed from daniel to pespin
pespin, please take over
Updated by pespin almost 4 years ago
- Status changed from In Progress to Feedback
- % Done changed from 0 to 80
So in summary:
- I tested with B200 + osmo-trx-uhd + multi-arfcn with 2 TRX
- I tested with LimeSDR-USB + osmo-trx-lms + 1 TRX
- I had to run osmo-pcu also with SCHED_RR (-r 1) to avoid having issues with PDTCH Dl blocks not enqueued quickly enough in BTS (related to rts-advance value)
- I also noticed that using a more conservative logging levels (I was using a quite verbose and compute intensive one for RLCMAC category) also helps in getting more stable.
- "fn-advance" can be decreased to 2 by default, it worked fine. "rts-advance is on the edge already, so I wouldn't touch that one.
I also submitted patches improving some related scheduler code to provide more information. I also added rate counters in order to display issues related to fn-advance and rts-advance ("show rate-counters" in osmo-bts).
Updated by pespin almost 4 years ago
I did some testing with a LimeNET-micro and so far it looks good from osmo-bts-trx side, but it's not working properly on osmo-trx-lms side due to Tx downlink bursts arriving too late when using fn-advance 2 or 3, I get lots of messages like this from time to time:
DTRXDDL <0003> Transceiver.cpp:430 [tid=140424023869184][chan=0] dumping STALE burst in TRX->SDR interface (0:2005343 vs 1:2005343), retrans=0
I'm running all through systemd services and they have realtime scheduling set in the service files.
I added some rate counters to monitor that kind of issue in osmo-trx, and provide also some VTY command to establish a threshold at which osmo-trx will exit to flag the BTS that something's wrong, like we do for other counters (overruns, underruns, dropped packets, etc.):
remote: https://gerrit.osmocom.org/c/osmo-trx/+/19050 Rename device specific rate counter multi-thread helpers
remote: https://gerrit.osmocom.org/c/osmo-trx/+/19051 Introduce rate counter tx_stale_bursts
While at it, I also fixed some bug in the rate counter thresholds I observed.
Updated by pespin almost 4 years ago
Using current default fn values (20 and so), I have been running osmo-bts-trx+osmo-trx-lms in LimeNet-Micro3 for a few hours with 1 phone attached and pinging some IP addr. Then check over time the related rate counters:
in osmo-bts-trx:
trx_clk:sched_dl_miss_fn: 0 (0/s 0/m 0/h 0/d) Downlink frames scheduled later than expected due to missed timerfd event (due to high system load)
This one didn't change over time, which is good.
But then in osmo-trx-lms:
trx:tx_stale_bursts:        232 (0/s 22/m 232/h 0/d) Number of Tx burts dropped by TRX due to arriving too late
trx:tx_stale_bursts:       1849 (0/s 0/m 1849/h 1793/d) Number of Tx burts dropped by TRX due to arriving too late
trx:tx_stale_bursts:       5067 (0/s 0/m 1890/h 5031/d) Number of Tx burts dropped by TRX due to arriving too late
trx:tx_stale_bursts:       5201 (0/s 0/m 2024/h 5031/d) Number of Tx burts dropped by TRX due to arriving too late
trx:tx_stale_bursts:       6156 (0/s 0/m 1125/h 5998/d) Number of Tx burts dropped by TRX due to arriving too late
So we are dropping around 2k bursts per hour aprox, with current settings. I still need to figure out what fn param relates to that.
Updated by pespin almost 4 years ago
After a few more hours with the test running with same environment, I continue to have trx_clk:sched_dl_miss_fn at 0 and trx:tx_stale_bursts at around 2425/h
Regarding that counter, I just found out that there may be a race condition between getStaleBurst() and getCurrentBurst(), where a burst is fed in the queue in between and then getCurrentBurst() fails because the required one may be not the first one even if it was queued and getStaleBurst() will later drop it. So we potentially need to refactor that code to avoid those issues., and repeat the test (adding an extra counter for the case where getCurrentBurst fails, because then by comparing with the other one it can be known if bursts arrived late or never arrived).
If that's not introducing an issue, then we need to investigate whether lowering fn_advance further degrades the current situation or not.
Updated by pespin almost 4 years ago
I submitted a bunch of more patches fixing the potential race condition as well as adding more counters useful to gasp timing issues:
remote: https://gerrit.osmocom.org/c/osmo-trx/+/19206 Transceiver: Fix race condition obtaining Dl burst from Upper layer
remote: https://gerrit.osmocom.org/c/osmo-trx/+/19207 Add rate counter for missing Txbursts when scheduled towards the radioInterface
remote: https://gerrit.osmocom.org/c/osmo-trx/+/19205 Introduce rate counters to detect issues in received Dl bursts from TRXD
Updated by fixeria almost 4 years ago
A few days ago I implemented the transmit queue in fake_trx.py, so now it behaves just like a normal transceiver and reflects the negative impact of high fn-advance values, see https://osmocom.org/issues/4658#note-8. TL;DR several test cases from ttcn3-bts-test started to fail with queuing enabled. I also believe, that high fn-advance value could most likely be the reason of permanent BTS_Tests.TC_rsl_modify_encr failures. The test case expects a new encryption key to be applied immediately, while on practice it's applied 20 TDMA frames later (5 xCCH frames).
Updated by pespin almost 4 years ago
After a few hours running same test I did a few days ago (limenet-micro, 1 MS pinging for a few hours, default fn-advance 20):
OsmoTRX# show rate-counters
osmo-trx statistics 0:
       device:rx_overruns:          0 (0/s 0/m 0/h 0/d) Number of Rx overruns in FIFO queue
      device:tx_underruns:          0 (0/s 0/m 0/h 0/d) Number of Tx underruns in FIFO queue
    device:rx_drop_events:          0 (0/s 0/m 0/h 0/d) Number of times Rx samples were dropped by HW
   device:rx_drop_samples:          0 (0/s 0/m 0/h 0/d) Number of Rx samples dropped by HW
    device:tx_drop_events:          3 (0/s 0/m 0/h 3/d) Number of times Tx samples were dropped by HW
   device:tx_drop_samples:          3 (0/s 0/m 0/h 3/d) Number of Tx samples dropped by HW
      trx:tx_stale_bursts:      13274 (0/s 0/m 7556/h 10075/d) Number of Tx burts dropped by TRX due to arriving too late
trx:tx_unavailable_bursts:      13599 (0/s 0/m 7660/h 10377/d) Number of Tx burts unavailable (not enqueued) at the time they should be transmitted
  trx:tx_trxd_fn_repeated:          0 (0/s 0/m 0/h 0/d) Number of Tx burts received from TRXD with repeated FN
trx:tx_trxd_fn_outoforder:          0 (0/s 0/m 0/h 0/d) Number of Tx burts received from TRXD with a past FN
   trx:tx_trxd_fn_skipped:        141 (0/s 0/m 104/h 118/d) Number of Tx burts potentially skipped due to FN jumps
For reference, after few startup seconds, all were 0 and trx:tx_unavailable_bursts=184 (expected during startup to have some until it stabilizes).
And osmo-bts-trx:
OsmoBTS# show rate-counters
L1 scheduler timeslot 17:
       l1sched_ts:dl_late:          3 (0/s 0/m 0/h 3/d) Downlink frames arrived too late to submit to lower layers
  l1sched_ts:dl_not_found:          4 (0/s 0/m 0/h 4/d) Downlink frames not found while scheduling
L1 scheduler timeslot 16:
       l1sched_ts:dl_late:          3 (0/s 0/m 0/h 3/d) Downlink frames arrived too late to submit to lower layers
  l1sched_ts:dl_not_found:          4 (0/s 0/m 0/h 4/d) Downlink frames not found while scheduling
L1 scheduler timeslot 15:
       l1sched_ts:dl_late:          0 (0/s 0/m 0/h 0/d) Downlink frames arrived too late to submit to lower layers
  l1sched_ts:dl_not_found:          0 (0/s 0/m 0/h 0/d) Downlink frames not found while scheduling
L1 scheduler timeslot 14:
       l1sched_ts:dl_late:          0 (0/s 0/m 0/h 0/d) Downlink frames arrived too late to submit to lower layers
  l1sched_ts:dl_not_found:          0 (0/s 0/m 0/h 0/d) Downlink frames not found while scheduling
L1 scheduler timeslot 13:
       l1sched_ts:dl_late:          0 (0/s 0/m 0/h 0/d) Downlink frames arrived too late to submit to lower layers
  l1sched_ts:dl_not_found:          0 (0/s 0/m 0/h 0/d) Downlink frames not found while scheduling
L1 scheduler timeslot 12:
       l1sched_ts:dl_late:          0 (0/s 0/m 0/h 0/d) Downlink frames arrived too late to submit to lower layers
  l1sched_ts:dl_not_found:          0 (0/s 0/m 0/h 0/d) Downlink frames not found while scheduling
L1 scheduler timeslot 11:
       l1sched_ts:dl_late:          0 (0/s 0/m 0/h 0/d) Downlink frames arrived too late to submit to lower layers
  l1sched_ts:dl_not_found:          0 (0/s 0/m 0/h 0/d) Downlink frames not found while scheduling
L1 scheduler timeslot 10:
       l1sched_ts:dl_late:          0 (0/s 0/m 0/h 0/d) Downlink frames arrived too late to submit to lower layers
  l1sched_ts:dl_not_found:          0 (0/s 0/m 0/h 0/d) Downlink frames not found while scheduling
E1 Input subsystem 0:
               hdlc:abort:          0 (0/s 0/m 0/h 0/d) HDLC abort
             hdlc:bad_fcs:          0 (0/s 0/m 0/h 0/d) HLDC Bad FCS
             hdlc:overrun:          0 (0/s 0/m 0/h 0/d) HDLC Overrun
                    alarm:          0 (0/s 0/m 0/h 0/d) Alarm
                  removed:          0 (0/s 0/m 0/h 0/d) Line removed
cell broadcast channel 1:
         cbch:rcvd_queued:          0 (0/s 0/m 0/h 0/d) Received + queued CBCH messages (Abis)
        cbch:rcvd_dropped:          0 (0/s 0/m 0/h 0/d) Received + dropped CBCH messages (Abis)
         cbch:sent_single:          0 (0/s 0/m 0/h 0/d) Sent single CBCH messages (Um)
        cbch:sent_default:          0 (0/s 0/m 0/h 0/d) Sent default CBCH messages (Um)
           cbch:sent_null:          0 (0/s 0/m 0/h 0/d) Sent NULL CBCH messages (Um)
cell broadcast channel 0:
         cbch:rcvd_queued:          0 (0/s 0/m 0/h 0/d) Received + queued CBCH messages (Abis)
        cbch:rcvd_dropped:          0 (0/s 0/m 0/h 0/d) Received + dropped CBCH messages (Abis)
         cbch:sent_single:          0 (0/s 0/m 0/h 0/d) Sent single CBCH messages (Um)
        cbch:sent_default:          0 (0/s 0/m 0/h 0/d) Sent default CBCH messages (Um)
           cbch:sent_null:          0 (0/s 0/m 0/h 0/d) Sent NULL CBCH messages (Um)
osmo-bts-trx specific counters 0:
 trx_clk:sched_dl_miss_fn:          0 (0/s 0/m 0/h 0/d) Downlink frames scheduled later than expected due to missed timerfd event (due to high system load)
base transceiver station 0:
              paging:rcvd:          0 (0/s 0/m 0/h 0/d) Received paging requests (Abis)
              paging:drop:          0 (0/s 0/m 0/h 0/d) Dropped paging requests (Abis)
              paging:sent:          0 (0/s 0/m 0/h 0/d) Sent paging requests (Um)
                rach:rcvd:         33 (0/s 0/m 20/h 30/d) Received RACH requests (Um)
                rach:drop:          3 (0/s 0/m 1/h 3/d) Dropped RACH requests (Um)
            rach:handover:          0 (0/s 0/m 0/h 0/d) Received RACH requests (Handover)
                  rach:cs:          5 (0/s 0/m 3/h 4/d) Received RACH requests (CS/Abis)
                  rach:ps:         25 (0/s 0/m 16/h 23/d) Received RACH requests (PS/PCU)
                agch:rcvd:          5 (0/s 0/m 3/h 4/d) Received AGCH requests (Abis)
                agch:sent:         30 (0/s 0/m 19/h 27/d) Sent AGCH requests (Abis)
              agch:delete:          0 (0/s 0/m 0/h 0/d) Sent AGCH DELETE IND (Abis)
So from those numbers, my opinion is that on the BTS side, everything looks quite good. I think those 3-4 bursts lost during around 4 hourson TS0 and TS1 we can ignore.
On the TRX side, it looks much worse. More or less tx_unavailable_bursts - 184 (startup drop) - tx_trxd_fn_skipped = tx_stale_bursts.
So 99% of the issues are basically bursts arriving too late to the Lower Layer TX thread pushing stuff into the SDR. My observation is that these usually happen in big bursts of hundreds of thousands of FNs at the same time (the counter increments a lot in a few seconds).
Finally, we get 144 skipped FN, which corss-checking against BTS, means either
1- The Kernel dropped UDP packets between BTS->TRX
2- There is some bug in BTS sometimes not sending DL packets and not being counted in the counter.
Updated by pespin almost 4 years ago
I switched to fn-dvance 6 on the same setup, I get similar (dropped/too-late) values to the ones I got with fn-advance 20. I have the feeling is going to be in timing/locking between threads in osmo-trx rather than between fn-advance between osmo-trx and osmo-bts-trx. For instance one candiadate may be the radioClock Time being locked/unlocked several times with different threads operating on its values and creating some race conditions. That's only a blind guess so far.
osmo-trx statistics 0:
       device:rx_overruns:          0 (0/s 0/m 0/h 0/d) Number of Rx overruns in FIFO queue
      device:tx_underruns:          0 (0/s 0/m 0/h 0/d) Number of Tx underruns in FIFO queue
    device:rx_drop_events:          0 (0/s 0/m 0/h 0/d) Number of times Rx samples were dropped by HW
   device:rx_drop_samples:          0 (0/s 0/m 0/h 0/d) Number of Rx samples dropped by HW
    device:tx_drop_events:          3 (0/s 0/m 0/h 3/d) Number of times Tx samples were dropped by HW
   device:tx_drop_samples:          3 (0/s 0/m 0/h 3/d) Number of Tx samples dropped by HW
      trx:tx_stale_bursts:      11566 (0/s 0/m 6986/h 11566/d) Number of Tx burts dropped by TRX due to arriving too late
trx:tx_unavailable_bursts:      11646 (0/s 0/m 6986/h 11646/d) Number of Tx burts unavailable (not enqueued) at the time they should be transmitted
  trx:tx_trxd_fn_repeated:          0 (0/s 0/m 0/h 0/d) Number of Tx burts received from TRXD with repeated FN
trx:tx_trxd_fn_outoforder:          0 (0/s 0/m 0/h 0/d) Number of Tx burts received from TRXD with a past FN
   trx:tx_trxd_fn_skipped:          0 (0/s 0/m 0/h 0/d) Number of Tx burts potentially skipped due to FN jumps
I also created ticket #4679 to get rid of some bursty log line about rach clipping which may also help getting rid of some unstabilities.
So my opinion right now on the ticket's topic is: I need to do more testing, but looks like we'll be able to decrease fn-advance since the situation is not worse than with a higher value.
Updated by pespin almost 4 years ago
BTW, I forgot to say that while running the long test, I see from time to time this from the kernel on journalctl, which may also cause unstabilities:
Jul 24 17:44:01 limenet-micro3 rngd[381]: stats: bits received from HRNG source: 120064
Jul 24 17:44:01 limenet-micro3 rngd[381]: stats: bits sent to kernel pool: 64096
Jul 24 17:44:01 limenet-micro3 rngd[381]: stats: entropy added to kernel pool: 64096
Jul 24 17:44:01 limenet-micro3 rngd[381]: stats: FIPS 140-2 successes: 6
Jul 24 17:44:01 limenet-micro3 rngd[381]: stats: FIPS 140-2 failures: 0
Jul 24 17:44:01 limenet-micro3 rngd[381]: stats: FIPS 140-2(2001-10-10) Monobit: 0
Jul 24 17:44:01 limenet-micro3 rngd[381]: stats: FIPS 140-2(2001-10-10) Poker: 0
Jul 24 17:44:01 limenet-micro3 rngd[381]: stats: FIPS 140-2(2001-10-10) Runs: 0
Jul 24 17:44:01 limenet-micro3 rngd[381]: stats: FIPS 140-2(2001-10-10) Long run: 0
Jul 24 17:44:01 limenet-micro3 rngd[381]: stats: FIPS 140-2(2001-10-10) Continuous run: 0
Jul 24 17:44:01 limenet-micro3 rngd[381]: stats: HRNG source speed: (min=356.911; avg=569.452; max=937.065)Kibits/s
Jul 24 17:44:01 limenet-micro3 rngd[381]: stats: FIPS tests speed: (min=2.041; avg=6.361; max=14.087)Mibits/s
Jul 24 17:44:01 limenet-micro3 rngd[381]: stats: Lowest ready-buffers level: 2
Jul 24 17:44:01 limenet-micro3 rngd[381]: stats: Entropy starvations: 0
Jul 24 17:44:01 limenet-micro3 rngd[381]: stats: Time spent starving for entropy: (min=0; avg=0.000; max=0)us
Updated by pespin over 3 years ago
I did some more tests with LimeNet-micro this time applying ultra-low values proposed by Daniel in https://gerrit.osmocom.org/c/osmo-bts/+/17766, and I get similar results to those with current values (high timing ones), so to me it's a green light towards going ahead setting the new lower default values. It also confirms that the issue with dropped DL bursts is within osmo-trx threads themselves, and should be investigated separately.
OsmoTRX# show rate-counters
osmo-trx statistics 0:
       device:rx_overruns:          0 (0/s 0/m 0/h 0/d) Number of Rx overruns in FIFO queue
      device:tx_underruns:          0 (0/s 0/m 0/h 0/d) Number of Tx underruns in FIFO queue
    device:rx_drop_events:          0 (0/s 0/m 0/h 0/d) Number of times Rx samples were dropped by HW
   device:rx_drop_samples:          0 (0/s 0/m 0/h 0/d) Number of Rx samples dropped by HW
    device:tx_drop_events:          3 (0/s 0/m 3/h 3/d) Number of times Tx samples were dropped by HW
   device:tx_drop_samples:          3 (0/s 0/m 3/h 3/d) Number of Tx samples dropped by HW
      trx:tx_stale_bursts:      10054 (0/s 0/m 10054/h 8489/d) Number of Tx burts dropped by TRX due to arriving too late
trx:tx_unavailable_bursts:      10094 (0/s 0/m 10094/h 8529/d) Number of Tx burts unavailable (not enqueued) at the time they should be transmitted
  trx:tx_trxd_fn_repeated:          0 (0/s 0/m 0/h 0/d) Number of Tx burts received from TRXD with repeated FN
trx:tx_trxd_fn_outoforder:          0 (0/s 0/m 0/h 0/d) Number of Tx burts received from TRXD with a past FN
   trx:tx_trxd_fn_skipped:          0 (0/s 0/m 0/h 0/d) Number of Tx burts potentially skipped due to FN jumps
       trx:rx_empty_burst:          0 (0/s 0/m 0/h 0/d) Number of Rx bursts empty
          trx:rx_clipping:      40086 (0/s 3944/m 39599/h 13817/d) Number of Rx bursts discarded due to clipping
 trx:rx_no_burst_detected:          0 (0/s 0/m 0/h 0/d) Number of Rx burts discarded due to burst detection error
(the high clipping here is unrelated and happens because I have the MS at 30cm from the LimeNetMicro pinging some internet host).
Updated by pespin over 3 years ago
- Status changed from Feedback to Resolved
- % Done changed from 80 to 100
https://gerrit.osmocom.org/c/osmo-bts/+/17766 was merged, closing.
Updated by laforge over 3 years ago
- Related to Bug #4074: LAPD timers completely broken added

